
Study of manufacturing websites
Many manufacturers have talked with me about problems with their websites. It seemed to be a diverse set of mistakes, but I had not gathered all the information to make an informed analysis.
After fighting a long list of website marketing problems, I decided to do a large-scale manufacturing website marketing study. If you want to see fix recommendations for these common manufacturing website problems, go to the Fix Manufacturing Websites Mistakes page.
Here is the study which includes information about the most common problems and how manufacturers can use this information to improve their own websites and marketing.
You can download and SHARE the full study as a PDF file: Website Marketing Study for Manufacturing
Marketing opportunities for manufacturing website
A study to determine the current state of website marketing techniques used by manufacturers and to provide improvement recommendations.
Executive summary for the Study of manufacturing websites
Arkansas manufacturers have done a good job with their websites by providing a fairly good user experience with effective navigation, no use of frames, and limited use of FrontPage which is no longer supported by Microsoft. However, they have significant opportunities for improvement in search engine visibility and selling methods as shown by poor keyword use and lack of a sitemap to direct search engines to their web pages.
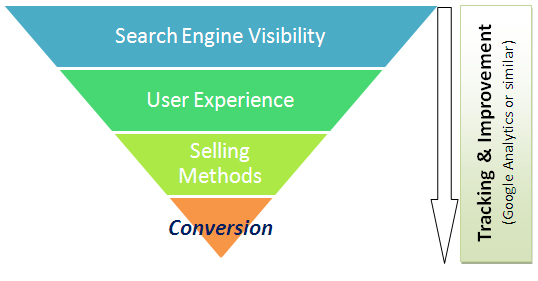
Most visitors to a manufacturer’s website will progress through the steps shown in the Sales Funnel of Figure 1. The sales funnel shape represents the reduction in the number of visitors at each step as visitors move toward conversion. For most Arkansas manufacturers, a large number of potential leads are missed at the Search Engine Visibility step. Even when visitors manage to find a site, the lack of emphasis on the Selling Methods step prevents the manufacturers from converting visitors to sales or warm sales leads. Note that each of the 23 assessment components in the study is categorized by how they fit in each step.
The next step for Arkansas manufacturers
Because of the significant opportunities for improving sales by improving all steps in the sales funnel shown in Figure 1, Arkansas manufacturers should invest time in improving their website’s weakest areas – Search Engine Visibility and online Selling Methods. Selling Methods, such as adding Calls to Action and contact information to the top of each page, can be the easiest improvements and can have the quickest impact. For Search Engine Visibility, each company should add the free Google Analytics service to their website and add a SITEMAP.XML file to show search engines where web pages are located.
Each company received an individualized assessment. The assessment provides a list of website-specific recommendations that they should consider for implementation with their developer.
Introduction to the Study of manufacturing websites
This assessment study could not have been completed without the active participation of Arkansas manufacturers, the assistance and recommendations of Arkansas Manufacturing Solutions staff, and the help of several others. Your support is appreciated.
This study provides specific improvement ideas that manufacturers can implement. If you have unusual success or unusual difficulty, please let us know.
Design of the Study of manufacturing websites
The study was designed with the following specifications:
- Limited to 43 manufacturers based on a self-selection process of signups.
- Arkansas manufacturers
- five or more employees
- with an active website
- information submitted prior to the end of the submittal period
Goals of the Study of manufacturing websites
Because of time limitations and a large amount of data, the goals of the study were limited to these two items:
- Identify the greatest opportunities for website marketing improvements for small and mid-sized manufacturers.
- Assist Arkansas manufacturers by providing actionable recommendations to improve their sales leads and potentially impact the economy of Arkansas.
Summary of the results
Before data was extracted from the websites of the 43 manufacturing participants, a quick phone interview was used to gather information not available on the website. The two study components, the phone interview component and the website component are listed below.
Phone interview component of the study
The phone interview revealed the following information about the study group:
- Companies had between 5 and 200 employees
- Pay-per-click advertising was used by 31% of the companies with Google Adwords being the most commonly used service
- Pay-per-click budgets ranged from $31 per month (Google Adwords minimum) to $1000 per month
- Industrial website directories (Global Spec, Process Register, Thomas Register, etc) were used in a limited way with 60% of the companies not using the listings at all. The free listing approach was used by 16% while 24% paid to have preferred listings. The budgets range from $3000 to $6000 per year for those who pay for listings.
Phone interview results and assesment
- If you pay for industrial website listings, make sure to validate which visitors and websites are driving sales for your company. Google Analytics can show this information. Note that of the 24% who pay to have listings, only 16% track their visits with Google Analytics. This means that 8% of the companies are spending online ad money without knowing the results of the cost.
- Website hosting is done internally in 8% of the companies surveyed, while 92% use a website hosting service.
- Manufacturers hired a developer to design their website in 80% of the companies and 20% did their own website development
Website Analysis component of the study
For the website component of the study, there were 23 assessment components (shown in Tables 1 and 2) and two additional data sets. The additional data sets were for general comments made while the assessment was being processed and for improvement recommendations.
Table 1 - Yes/No Evaluation
| Classification | Criteria | Yes | No |
|---|---|---|---|
| Search Engine Visibility | Use of H1 tags | 24% | 76% |
| Search Engine Visibility | Use of Meta tags | 7% | 93% |
| Search Engine Visibility | Use of CSS | 51% | 49% |
| Search Engine Visibility | Effective Keyword Use | 0% | 100% |
| Search Engine Visibility | Use of ROBOTS TXT file | 33% | 67% |
| Search Engine Visibility | Use of SITEMAP XML file | 12% | 88% |
| User Experience | Effective Navigation | 65% | 35% |
| User Experience | Significant Content | 56% | 44% |
| User Experience | Text Used Instead of Flash | 93% | 7% |
| User Experience | Text Used Instead of Flash | 93% | 7% |
| User Experience | Contact Forms Used | 42% | 58% |
| User Experience | Products or Services Described | 56% | 44% |
| User Experience | Large Amount of PDF files Used | 5% | 95% |
| User Experience | Internal Focus (Vision, etc) | 35% | 65% |
| User Experience | Use of Frames | 2% | 98% |
| Site Functionalities | FrontPage Based | 16% | 84% |
| Site Functionalities | FrontPage Based | 16% | 84% |
| Selling Methods | Call to Actions Used | 26% | 74% |
| Selling Methods | Overt Benefit Described | 12% | 88% |
| Selling Methods | Contact Information Near the Top | 14% | 86% |
| Tracking and Improvement | Use of Google Analytics | 16% | 84% |
Table 2 - Percentage and Count Components
| Classification | Criteria | Avg | Low | High | Median |
|---|---|---|---|---|---|
| Search Engine Visibility | Pages Indexed by Google | 71% | 0% | 100% | 80% |
| Search Engine Visibility | Pages Indexed by Yahoo! | 62% | 0% | 100% | 80% |
| Search Engine Visibility | Pages Indexed by MSN | 41% | 0% | 100% | 35% |
| Search Engine Visibility | Inbound Links on Google | 8 | 0 | 187 | 1 |
Assessment overview
The assessment looks specifically at 23 important components tied to the effectiveness of website marketing for Arkansas’s manufacturers and this information is shown in the “Results by Assessment Component” section. After looking at these components, a list of individualized improvement recommendations was developed for each company to assist them in determining what additional steps to consider for a redesign or update.
Note that items 16 through 19 are marked with (negative) to indicate that an answer of Yes is a problem. An explanation of the importance of each element in the assessment is provided in the section titled “Assessment Components Explained.”
This assessment does not address all potential improvements. Multiple additional improvements can be discovered by looking at visitor data through Google Analytics, performing competitive analysis, or doing optimization with testing.
Results by assessment component of the website analysis
Use of <H1> Headings Format
The H1 heading is considered highly important to search engines because it is used to describe the central concept of a page. If it is not present, the search engine has to guess what the page is about
26% of the companies participating in the survey effectively use the H1 tag.
Consistent page focus
If you have a consistent page focus, it will tend to move your website page higher in the search engine rankings which will increase the number of qualified visits to that web page. A consistent page focus aligns the page title, the <H1> heading, the readable content, the alt tags for images, and even file names around a single keyword phrase.
Only 7% are using consistent pages focus effectively.
CSS formatting use
CSS, or Cascading Style Sheets, is a shortcut for setting the format of pages in an entire website by only changing a single file. As an example, the CSS file may say that H1 should be bold, red, and italicized. Instead of having to change 100s of pages manually, changing the CSS file would update every format that has the H1 format tag.
More than half (51%) are using Cascading Style Sheets to effectively display their website.
Effective keyword use
A keyword phrase should be the focus of a page. “Effective Use” means that a single keyword phrase is defined for a page and all elements on that page are aligned with that single keyword phrase.
No single company has used keywords to their full potential. Good use of keywords would include 1 to 3 keyword phrases per page with the keyword Meta tag, content, page title, <H1> heading, and image alt tags aligned to the selected keyword.
Pages indexed by Google
Google receives about 70% of the searches in the U.S. If your pages are not indexed, that means the search engines do not know they exist. Search engines cannot list your non-indexed pages in search results.
On average, 71% of the pages of a company were indexed by Google with a median of 80%, a low of 0%, and a high of 100%.
Pages indexed by Yahoo
Yahoo receives about 20% of the searches in the U.S.
On average, 62% of the pages of a company were indexed by Yahoo with a median of 80%, a low of 0%, and a high of 100%.
Pages indexed by MSN
MSN (or Live.com) receives about 10% of the searches in the U.S.
On average, only 41% of the pages of a company were indexed by MSN with a median of 35%, a low of 0%, and a high of 100%. MSN’s limited performance may be tied to limitations on how they spider websites (find pages by looking at internal links) or possibly a less structured approach to using SITEMAP.XML files to index pages. They may also just be selective with what they choose to include in their index.
ROBOTS.TXT file present
This file tells search bots that analyze your site what locations are OK to search. Some search engines will not look at your website until this file exists.
Only 33% of companies are effectively using ROBOTS.TXT, which is needed before search engines try to index web pages.
SITEMAP.XML file present
This file tells the search engines what pages exist on your site and using it tends to improve the number of pages that are visible to the search engines.
Only 12% are using SITEMAP.XML effectively.
Inbound links
Inbound links are the links to your website that others have shown on their website. You can think of inbound links as votes that say your site is valuable. As you increase the number of good quality inbound links, your site will tend to receive additional visitors.
The average number of inbound links is 8. Most companies only have 1 inbound link. One company had 187 inbound links.
Effective navigation
One of the top reasons visitors get frustrated with a website and leave is the lack of good navigation. It should be easy for visitors to move around and find what is needed.
A majority of the websites (65%) have effective navigation.
A significant amount of user-readable text used
People (and search engines) are searching for information. Good readable text is critical to the success of most websites. Search engines and many people will not value images as much as text in most cases.
44% of the companies have a limited amount of readable text. A limited amount of readable text reduces the ability to be found through searches.
Text is used instead of Flash
Flash animation can be overused and is not read well by search engines. Text is preferred when communicating simple information.
Only 7% were using excessive Flash animation which can be detrimental to a website.
Contact forms present
The most important reasons to use a contact form instead of a linked e-mail are that it pre-qualifies sales leads and makes the action easier for the user to complete. Using a linked e-mail address increases spam e-mail. Plus, many users have not properly configured their computers to launch their preferred e-mail program when a linked e-mail address is clicked.
Less than half of the companies (42%) were using contact forms effectively to interact with customers and potential sales leads.
Products or services described
The primary reason to develop a business website is to sell products and services, not promote how wonderful a business might be. Unfortunately, companies often communicate their internal strengths instead of product or service information. Visitors usually are seeking product or service information.
A good description of products or services was present in 56% of websites.
A large amount of PDF file used
Using PDF files as part of the browsable part of a website causes users to become frustrated with the pause time to launch Acrobat Reader and the extra effort required to get back to the main web browser. PDF files are still valuable for printing with good formatting.
Only 5% were using PDF in an excessive way that could reduce website usability.
Internal focus
Potential customers are interested in what you can do for them. They are not interested in your internal information: vision statements, quality perception, or biographies of executives. Internal information can be provided on the website; it just should not be the first thing visitors see.
Approximately one in three companies (35%) focused on company information rather than focusing on the needs of the customer.
Use of frames
Frames are difficult for people and search engines to use effectively and are now considered obsolete. This is a serious problem for a website to have.
Only 2% of the companies studied were using frames that damage credibility and greatly reduce the potential of being located online.
The website is FrontPage based
Microsoft FrontPage extensions are no longer supported by Microsoft as of 2008. Also, there are multiple issues with FrontPage that prevent it from being considered a good design platform.
Nearly all companies (84%) are using something other than FrontPage to develop their websites.
Calls to action present
If you ask your visitors to click, read, or call, they will tend to do those actions more often. Calls to action can be one of the most powerful sales methods available to your website.
About one in four companies (26%) are actively engaging potential customers through calls to action.
Overt benefit described
An overt benefit is one that customers enjoy, stated in an obvious way. Overt Benefit, Real Reason to Believe, and Dramatic Difference are 3 elements described by Eureka Winning Ways growth coaches to help increase sales and develop new product lines.
Only 12% of the companies describe the overt benefit of their products to help customers understand how their company can be helpful.
Contact information at the top
Having your physical address and phone number at the top of every page has been shown to increase trust in your website. The contact information also captures more sales leads than burying the information on a Contact Us page.
Only 14% of the companies had contact information at the top of each page to drive sales and increase trust.
Google Analytics used
If you cannot see what visitors like, you cannot make strategic decisions for improvement. Google Analytics is free and it provides the number of visitors, source of visits (type in visits, search engine visits, etc), geographic location of visitors, and much more.
Only 16% of the companies in the study used the free Google Analytics service to look at how their site is performing.